Analytics
Analytics Overview
Read Dynamoi campaign, Smart Links, audience, YouTube, and revenue analytics for the active artist.
Analytics help identify trend direction over time across Smart Campaigns, YouTube Campaigns, Smart Links, and audience growth. Most platforms report with some delay, so focus on multi-day trends rather than single-day fluctuations.
Where analytics live
| Page | Use it for |
|---|---|
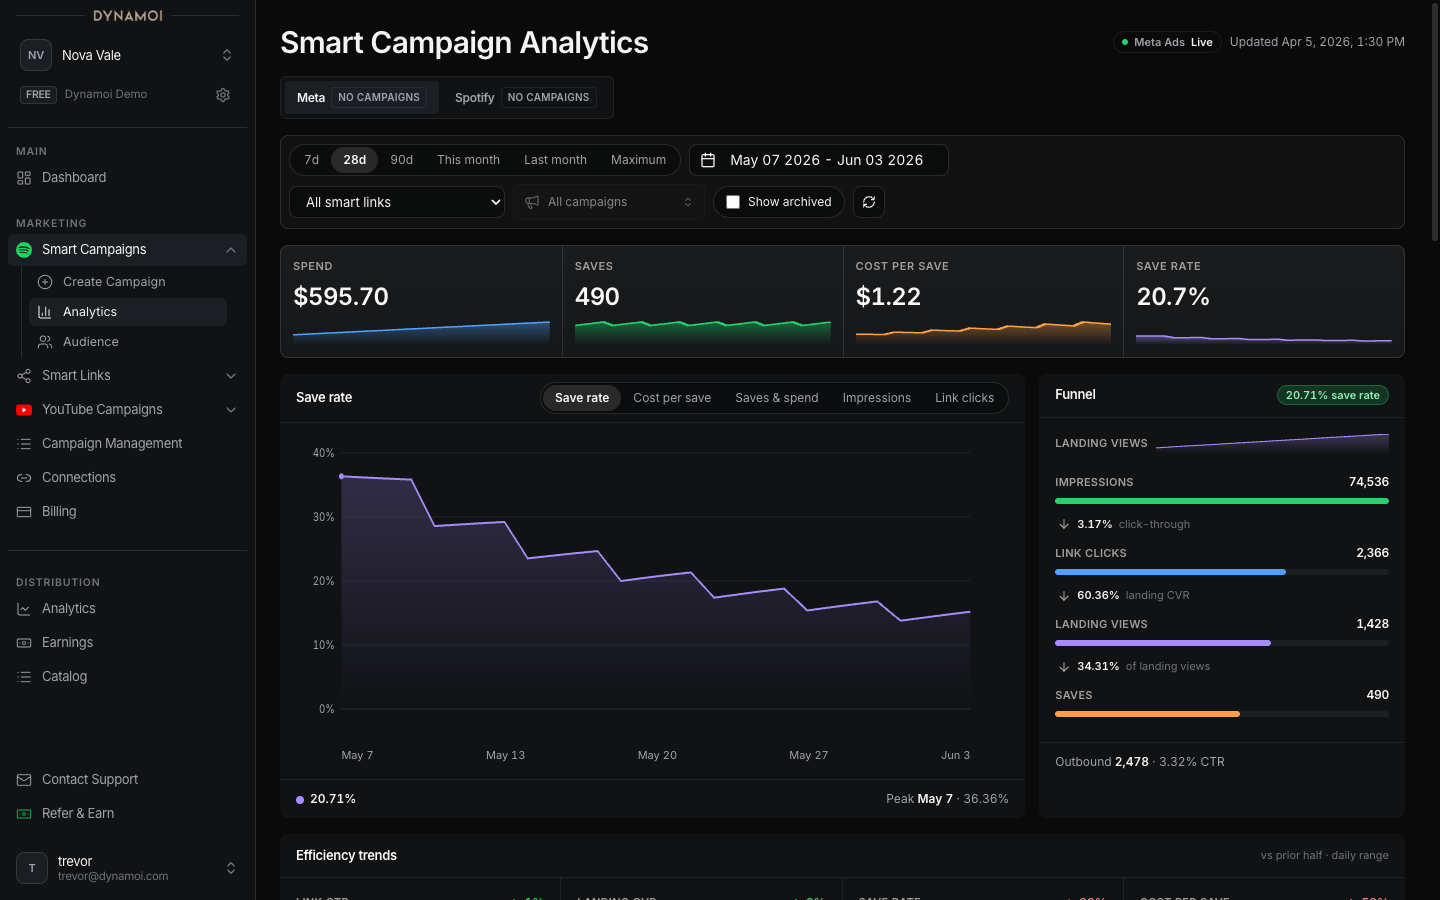
| Smart Campaign Analytics | Saves, save rate, link clicks, spend, and Smart Campaign efficiency |
| YouTube Analytics | Views, subscribers, watch signals, RPM, and AdSense revenue when connected |
| Audience Insights | Fan acquisition, geography, service mix, and exportable audience context |
| Smart Link Analytics & Settings | Free Smart Link visits, service clicks, themes, and pixels |
Date ranges
Analytics views support multiple time windows:
| Range | Best for |
|---|---|
| Last 7 days | Monitoring recent changes |
| Last 28 days | Primary reporting window |
| Last 90 days | Longer trend analysis |
| Custom / Maximum | Specific campaign periods |
Data freshness
Update timing varies by platform. Some actions appear later due to reporting delays and attribution windows.
Note When numbers appear mismatched between days, allow time for the platform to settle. Re-check using the 7-day or 28-day view for a more accurate picture.
Navigating analytics
Access analytics from the sidebar under Marketing. Smart Campaign and YouTube Campaign analytics are available in separate views, each tailored to the metrics most relevant for that campaign type.