Analytics
Smart Campaign Analytics
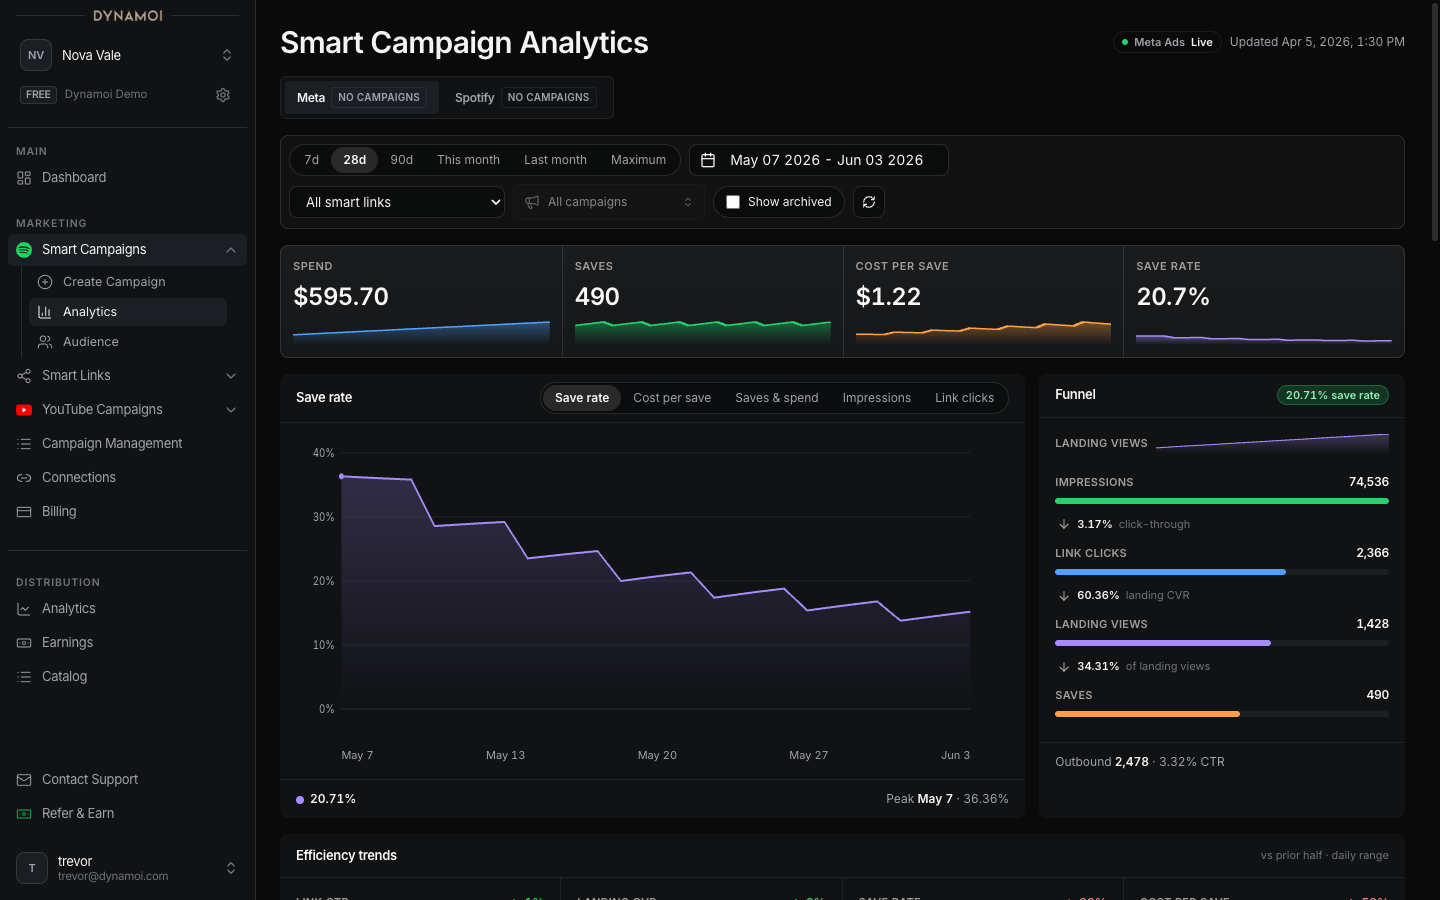
Read Smart Campaign saves, save rate, link clicks, spend, cost per save, learning variance, and trend direction.
Smart Campaign analytics reveal how ads drive streaming saves and link engagement. These metrics are central to understanding Spotify and Apple Music growth.
Primary metrics
| Metric | What it means |
|---|---|
Saves |
The primary Smart Campaign conversion event |
Link Clicks |
Clicks from the ad to your Smart Link landing page |
Save Rate |
Saves divided by Link Clicks |
Impressions |
Times the ad was shown |
Spend and efficiency
| Metric | What it means |
|---|---|
Spend (USD) |
Total spend for the selected date range |
Cost per Save |
Spend (USD) divided by Saves |
Efficiency metrics help determine whether a campaign is delivering value relative to its budget. A lower cost per save generally indicates stronger performance.
Learning and variance
During the first week, larger day-to-day swings are common as the ad platform optimizes delivery. Use the 7-day and 28-day views to judge overall trend direction rather than reacting to daily fluctuations.