Benchmarks shift, but they are still useful as a sanity check.
Dynamoi Exclusive Benchmarks
The numbers below come from aggregated performance across Dynamoi smart campaigns running Instagram‑heavy Meta ads from December 13, 2023 through December 12, 2026. They are anonymized, pooled across clients, and reported in billable ad spend terms.
Discovery CPM by Country Tier
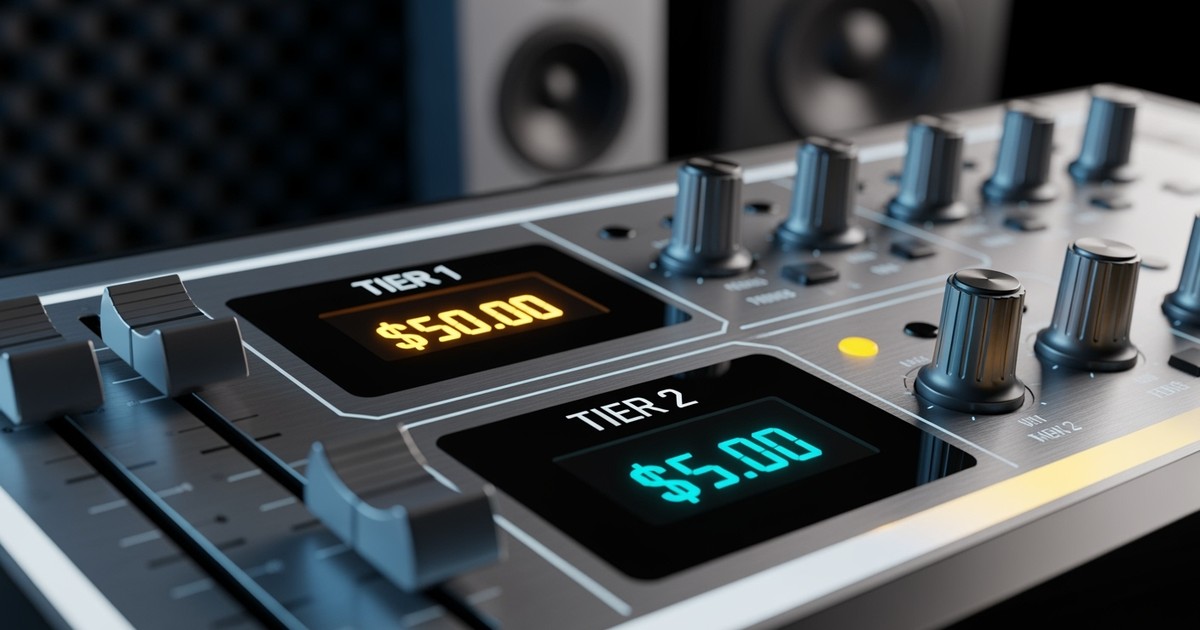
| Metric | Tier 1 | Tier 2 | Tier 3 |
|---|---|---|---|
| CPM (25th–75th percentile) | $22.86 to $77.14 (median $50.00, n=45) | $2.31 to $9.11 (median $5.00, n=179) | Tier 3 benchmarks will be added as volume supports |
If your CPM sits above the Tier range for your market, the system is telling you your first seconds are not competitive. Fix hook and framing before you touch targeting.
Intent Benchmarks
Intent benchmarks depend on how good your bridge is and how much the song fits the audience.
| Metric | Tier 1 | Tier 2 |
|---|---|---|
| Cost per save / follow (25th–75th percentile) | $2.51 to $4.70 (median $4.19) | $0.24 to $2.40 (median $0.49) |
Costs above these ranges are not automatically “bad.” They are bad only if downstream listening does not compound.
Industry Attention Benchmarks (Context)
As broad context, most Reels‑first music campaigns that are ready to scale sit in roughly these attention bands:
| Metric | Typical healthy range |
|---|---|
| ThruPlay rate | 18% to 35% |
| 3‑second view rate | 35% to 55% |
If you are below those, your creative is not earning attention, regardless of CPM.
How to Use These Numbers
- Use discovery benchmarks to decide whether a creative can win attention.
- Use intent benchmarks to decide whether the song is ready to scale.
- Compare apples to apples. A niche genre in Tier 1 will often cost more than mainstream pop in Tier 2, even with great creative.
Treat these as range checks, not promises. Your goal is to beat your last campaign, not to match a table.
The Streaming Revenue Endpoint
Ad benchmarks only tell half the story. The other half is what those saves and streams are worth. Our distribution data shows the following RPMs across major platforms:
| Platform | RPM (per 1,000 streams) |
|---|---|
| Amazon Music | $9.02 |
| TIDAL | $6.20 |
| YouTube Art Tracks | $5.28 |
| Deezer | $3.07 |
| Spotify | $3.02 |
| Pandora | $1.93 |
At the Tier 1 median cost per save of $4.19 and Spotify's $3.02/1K RPM, each save needs roughly 1,400 streams to break even on ad spend alone. That is achievable over 6-12 months when algorithmic lift compounds, but it underscores why funnel efficiency matters more than raw volume. Artists routing traffic to higher-RPM platforms like YouTube ($5.28/1K) or Apple Music can cut that break-even threshold significantly.