Streaming market size by country (2024)
Market-level streaming revenue is disclosed inconsistently across territories. The table below uses direct disclosures where available and calculated values where sources provide market totals and streaming shares.
| Market | Currency | Streaming revenue (2024) | YoY growth | Streaming share | Source |
|---|---|---|---|---|---|
| United States | USD | $14.9B | +4.0% | 84% | RIAA |
| United Kingdom | GBP | £1.02B | +5.7% | 68.1% | BPI |
| Germany | EUR | ~€1.86B | +12.6% | 78.1% | BVMI via MBW |
| France | EUR | €664M | +9.5% | N/A | SNEP |
| Spain | EUR | €450.1M | +12.9% | ~99% of digital | Promusicae |
| Italy | EUR | €308.1M | +13.5% | 67% | FIMI |
| Netherlands | EUR | >€278M | +15.0% | 83% | NVPI |
| Switzerland | CHF | >CHF226M | +10.0% | 91% | IFPI Switzerland |
| Sweden | SEK | >SEK2.0B | +8.0% | 91% | IFPI Sweden |
| Brazil | BRL | R$3.055B | N/A | 87.6% | Pro-Música Brasil |
| Mexico (2023) | USD | $463.8M | +18.4% | 94.5% | AMPROFON |
Note Germany reportedly overtook the UK as the world's third-largest music market in 2024, behind only the US and Japan.
US revenue composition
The $14.9B US streaming market breaks down by category:
| Category | 2024 revenue | Share of streaming |
|---|---|---|
| Paid subscriptions | $11.7B | 79% |
| Ad-supported on-demand | $1.8B | 12% |
| Digital/customized radio | $1.4B | 9% |
Paid subscriptions dominate US streaming economics. This matters for catalog strategy: premium listeners generate the bulk of the royalty pool, and their listening patterns differ from free-tier users.
Growth rate ranking
Among markets with disclosed 2024 data:
| Rank | Market | YoY growth |
|---|---|---|
| 1 | Mexico (2023 data) | +18.4% |
| 2 | Netherlands | +15.0% |
| 3 | Italy | +13.5% |
| 4 | Spain | +12.9% |
| 5 | Germany | +12.6% |
| 6 | Switzerland | +10.0% |
| 7 | France | +9.5% |
| 8 | Sweden | +8.0% |
| 9 | UK | +5.7% |
| 10 | US | +4.0% |
The pattern is clear: the largest markets (US, UK) are growing slowest in percentage terms. Mid-sized European markets are growing fastest. This has direct implications for where incremental marketing spend delivers the best return on a percentage basis.
Absolute growth context
Even at lower growth rates, large markets add meaningful absolute dollars:
| Market | Approx. absolute growth |
|---|---|
| US | +~$570M (4% on $14.9B) |
| Germany | +~€210M (12.6% on ~€1.86B) |
| UK | +~£55M (5.7% on £1.02B) |
| Italy | +~€37M (13.5% on €308M) |
The US added more absolute revenue than any other market despite its low growth rate. For revenue-focused labels, the US remains the priority; for growth-focused strategy, mid-tier European markets offer better marginal returns.
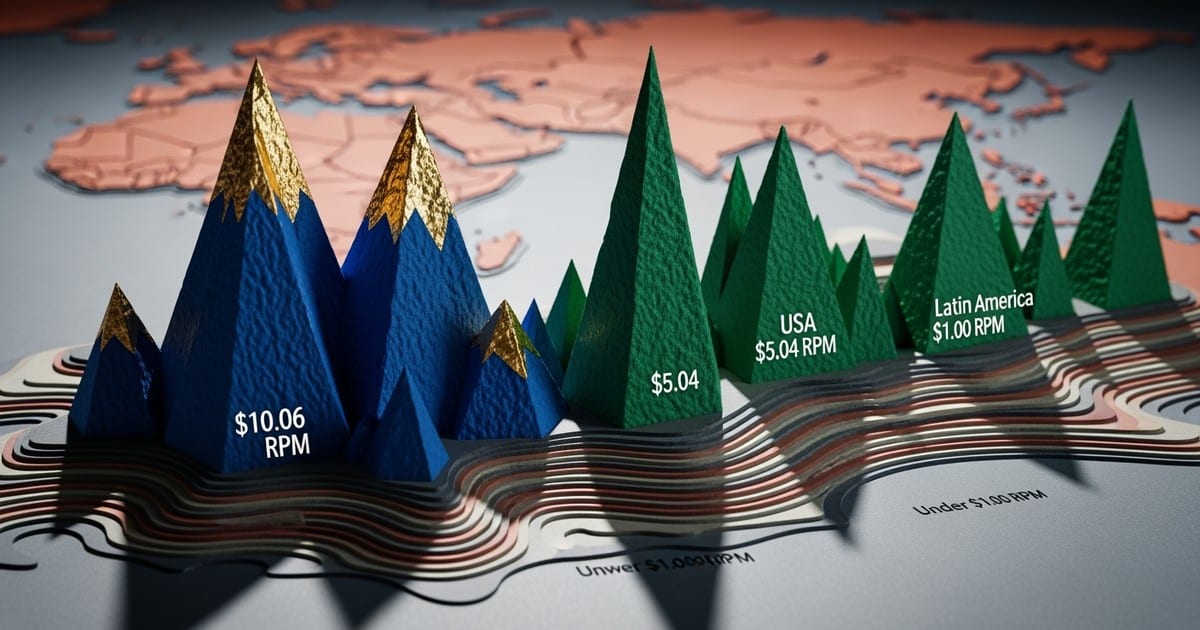
Per-stream rates by country
Per-stream rates vary dramatically by geography because royalty pools are country-specific. Higher subscription prices, higher paid-to-free ratios, and stronger ad markets all increase the local pool.
The live country breakdown belongs in the royalty data dashboard, not a static article table. Start there, then drill into service pages such as Spotify by country, Apple Music by country, YouTube Art Tracks by country, and TikTok by country.
For practical planning, group countries into four strategy buckets:
Premium monetization markets: US, UK, Germany, Switzerland, Canada, Australia, the Nordics, and Japan. These markets usually have stronger subscription pricing, stronger ad demand, and higher paid-tier penetration. They are the markets where paid acquisition has the clearest path to revenue.
Developed growth markets: France, Italy, Spain, Netherlands, Belgium, Austria, South Korea, Taiwan, and Singapore. These can combine meaningful RPM with faster growth, local editorial opportunities, or under-monetized audience pockets.
Scale-growth markets: Mexico, Brazil, Poland, Colombia, Argentina, and South Africa. These countries can deliver volume and cultural momentum, but campaign math needs lower direct royalty assumptions.
Long-term audience markets: India, Indonesia, Philippines, Nigeria, Egypt, Vietnam, and parts of MENA. These markets can matter enormously for fandom, video reach, diaspora discovery, and brand value, but direct per-stream monetization is usually not the main reason to invest.
The multiplier effect is the key concept. A high-RPM country can generate the same revenue from far fewer streams than a low-RPM country, while a low-RPM country can still matter if it creates scale, social proof, or downstream demand in higher-value markets.
What drives RPM differences
The 500x+ gap between top-tier and bottom-tier markets comes from compounding factors:
1. Subscription pricing
| Market | Typical individual plan | Approx. USD |
|---|---|---|
| UK | £10.99/month | ~$14 |
| US | $10.99/month | $11 |
| Germany | €10.99/month | ~$12 |
| Brazil | R$21.90/month | ~$4 |
| India | ₹119/month | ~$1.40 |
| Indonesia | Rp54,990/month | ~$3.50 |
| Nigeria | ₦900/month | ~$0.60 |
A UK subscriber pays roughly 10x what an Indian subscriber pays, and 23x what a Nigerian subscriber pays.
2. Paid vs free mix
Mature markets have higher premium subscriber ratios. In the US, 79% of streaming revenue comes from paid subscriptions. In emerging markets, free ad-supported tiers represent a much larger share of listening, and ad rates are also lower.
3. Ad rates
CPMs for ad-supported tiers vary dramatically:
| Market tier | Typical audio ad CPM |
|---|---|
| US/UK/Germany | $15-$30+ |
| Southern Europe | $8-$15 |
| Latin America | $3-$8 |
| Southeast Asia | $1-$4 |
| South Asia/Africa | $0.50-$2 |
4. Pool division
More streams in a market divide the pool more ways. India has massive listening volume, but the small pool gets divided among billions of streams, compressing per-stream rates further.
Regional growth trajectories
IFPI's Global Music Report 2025 shows the fastest regional growth coming from:
- Middle East & North Africa: Highest growth region globally
- Sub-Saharan Africa: Strong mobile-first expansion
- Latin America: Brazil and Mexico as anchor markets
Mature regions (North America, Western Europe) continue growing but at single-digit rates.
UK trajectory (derived from BPI)
| Year | Streaming revenue | YoY growth |
|---|---|---|
| 2022 | ~£890M | N/A |
| 2023 | ~£965M | +8.4% |
| 2024 | £1.02B | +5.7% |
Growth is decelerating. Plan UK campaigns around share capture (playlisting, conversion, retention) rather than assuming market growth lifts all boats.
Mexico trajectory (AMPROFON)
| Year | Streaming revenue | YoY growth |
|---|---|---|
| 2022 | ~$391.7M | N/A |
| 2023 | ~$463.8M | +18.4% |
Mexico combines meaningful scale with strong growth. Premium audio is the majority of revenue, but ad-supported and video remain material. The revenue mix (premium audio $288.7M, ad-supported audio $113.8M, video $61.3M in 2023) suggests conversion from free to paid remains an opportunity.
Brazil context
On-demand streaming is 87.6% of Brazil's R$3.081B recorded music market. This is one of the most streaming-dependent major markets globally. Spotify and YouTube define reach; Deezer has historically been stronger in Brazil than in most markets.
Per-capita monetization
Using approximate 2024 population figures with euro-denominated markets gives a penetration proxy:
| Market | Streaming revenue per capita | Population (M) |
|---|---|---|
| Switzerland | ~€27 | 8.8 |
| Germany | ~€22 | 84 |
| Netherlands | ~€16 | 17.5 |
| Sweden | ~€15 | 10.5 |
| France | ~€10 | 68 |
| Spain | ~€9 | 48 |
| Italy | ~€5 | 59 |
| Brazil | ~€3 | 215 |
Italy looks under-monetized relative to population and repertoire scale, but it is growing quickly (13.5%). This is often a "catch-up" signal where incremental marketing investment can outperform. Italy at €5 per capita versus Germany at €22 suggests significant headroom if subscription penetration increases.
Platform mix by market
Hard market-share data by country is rarely disclosed. The practical view for labels:
United States
Prioritize Spotify + Apple Music + Amazon Music. Paid subscription dominates: $11.7B of $14.9B streaming revenue in 2024 came from paid subs. YouTube Music matters for discovery and long-tail, but premium DSPs drive revenue.
United Kingdom
Spotify + Apple Music + Amazon + YouTube. BPI explicitly references these as key subscription providers. UK campaigns often win on editorial plus off-platform conversion; radio and press still influence playlist velocity.
Germany
Streaming is 78% of market value and growing 12.6%. Amazon matters due to Germany's Prime penetration. Expect Spotify-led editorial, but do not ignore Amazon's household plan dynamics.
France
Strong streaming growth with subscription as the main driver. Local editorial context is unusually influential due to language and domestic repertoire preferences. Local-language metadata and French market-specific releases can outperform English-only approaches.
Spain
Streaming is essentially the entire digital market (~99%). Audio DSP optimization is the primary revenue lever; video is meaningful but secondary at €73.8M versus audio at €376.3M.
Italy
Streaming is 67% of market value and growing double digits (13.5%). Strong mobile listening patterns and growing playlist culture. Given the low per-capita monetization, Italy is a market to build audience now for future revenue as the market matures.
Brazil
On-demand streaming is 87.6% of sector revenue. Spotify and YouTube define reach. Strong playlist and social amplification loops for local genres. Portuguese-language metadata is essential.
Mexico
Streaming is the market (94.5% of recorded music revenue). Revenue mix includes meaningful ad-supported and video, so plan for conversion to premium but also monetization of free listeners. Spanish-language catalog strategy is critical.
China
Local platforms dominate: Tencent Music (QQ Music, Kugou, Kuwo) and NetEase Cloud Music. Requires local distributor, separate compliance, and unique licensing structures. Our data shows ~$0.02 RPM, reflecting local platform economics rather than global DSP rates.
India
Discovery is video and mobile-first. YouTube Music matters for reach alongside Spotify. Subscription pricing is structurally low (~$0.21 RPM per our data). Treat as a scale and fandom market; monetization comes through touring, brand partnerships, and diaspora targeting in Tier 1 markets.
Indonesia
Similar dynamics to India: massive population, very low pricing, mobile-first discovery. At ~$0.08 RPM, direct monetization is minimal, but audience building for diaspora and brand opportunities can justify presence.
Practical implications for labels
Two-lens territory scorecard
For each target market, score on:
Value lens (monetization):
- RPM tier (use the first-party benchmarks above)
- Streaming share of total market
- Paid subscription mix
Growth lens:
- Market YoY streaming growth
- Platform expansion or bundle launches
- Competitive positioning opportunity
Territory classification framework
Tier 1 revenue markets (fund the business): UK, US, Germany, Switzerland, Canada, Australia, Nordics, Japan
- Focus on conversion and retention signals: saves, playlist placement, repeat listening
- Higher per-stream value justifies more frequent catalog touchpoints (deluxe editions, remasters, live versions)
- Playlist pitching and editorial relationships have highest ROI here
Tier 2 developed markets (strong value, moderate growth): France, Italy, Spain, Netherlands, Belgium, Austria, South Korea, Taiwan, Singapore
- Balance reach and monetization
- Italy and Netherlands particularly attractive given growth rates
- Local-language strategy matters in France, Italy, Spain
Tier 3 scale-growth markets (compound audience): Mexico, Brazil, Poland, Colombia, Argentina, South Africa
- Focus on reach and engagement signals: follows, playlist entry rate, video completion
- Plan for lower per-stream value; prioritize efficient channels
- Build community for future value as markets mature
Tier 4 emerging markets (long-term development): India, Indonesia, Philippines, Nigeria, Egypt, Vietnam, MENA region
- Treat as audience building and fandom development
- Per-stream monetization is minimal; revenue comes indirectly
- Diaspora targeting (fans in Tier 1 markets) can be more immediately valuable
- Mobile-first and video-first strategy essential
Blended payout math
For international catalogs, your blended payout per stream is:
Blended RPM = Σ (streams in country × RPM for country) / total streams
Example scenario:
- 100,000 streams from UK at $10 RPM = $1,000
- 100,000 streams from US at $6.28 RPM = $628
- 100,000 streams from India at $0.21 RPM = $21
- Total: 300,000 streams, $1,649 revenue
- Blended RPM: $5.50
If you shift the mix to 50% India streams:
- 75,000 UK streams = $750
- 75,000 US streams = $471
- 150,000 India streams = $32
- Total: 300,000 streams, $1,253 revenue
- Blended RPM: $4.18
A fast-growing low-RPM market can increase total streams while lowering blended RPM, even if total revenue rises. Track both metrics separately.
Geographic targeting for paid campaigns
When running paid acquisition campaigns, the geographic value difference should inform targeting:
| Campaign type | Geographic strategy |
|---|---|
| Revenue-focused | Target Tier 1 markets heavily; exclude Tier 5-6 |
| Awareness-focused | Include Tier 3-4 for efficient reach |
| Viral/social | May include all tiers for momentum |
| Playlist conversion | Focus on Tier 1-2 where playlists drive premium listening |
A campaign optimizing for lowest cost-per-stream may drive volume in low-RPM markets, destroying ROI. Always optimize for revenue outcomes, not stream volume.
Key benchmarks for planning
| Metric | Benchmark | Confidence |
|---|---|---|
| US streaming revenue (2024) | $14.9B | High |
| US streaming growth (2024) | +4.0% | High |
| US paid subscription share | 79% | High |
| UK streaming revenue (2024) | £1.02B | High |
| Germany streaming revenue (2024) | ~€1.86B | High |
| Fastest-growing major market (2024) | Netherlands +15% | High |
| UK RPM (Dynamoi first-party) | ~$10.05 | High |
| US RPM (Dynamoi first-party) | ~$6.28 | High |
| Germany RPM (Dynamoi first-party) | ~$4.57 | High |
| France RPM (Dynamoi first-party) | ~$2.84 | High |
| Italy RPM (Dynamoi first-party) | ~$2.64 | High |
| Mexico RPM (Dynamoi first-party) | ~$1.14 | High |
| Brazil RPM (Dynamoi first-party) | ~$0.85 | High |
| India RPM (Dynamoi first-party) | ~$0.21 | High |
| Indonesia RPM (Dynamoi first-party) | ~$0.08 | High |
| UK-to-India RPM ratio | ~48x | High |
| UK-to-Indonesia RPM ratio | ~127x | High |
| UK-to-Bangladesh RPM ratio | ~1,000x+ | High |
| Mexico streaming share of total revenue | 94.5% | High |
| Brazil streaming share of total revenue | 87.6% | High |
| Italy per-capita streaming revenue | ~€5 | Medium |
| Germany per-capita streaming revenue | ~€22 | Medium |
The bottom line: revenue maximization still comes primarily from high-RPM markets (UK, US, Germany, Switzerland, Nordics), but incremental audience scale is concentrated in emerging regions. The portfolio approach works best: treat fast-growing emerging markets as audience compounding, and mature markets as monetization and ROI. Use the RPM tiers above to make geographic targeting decisions that optimize for revenue, not vanity stream counts.