What Is the Difference Between CPM and RPM, and Which Matters?
Two metrics get confused constantly in YouTube earnings discussions.
| Metric | Definition | Who sees it |
|---|---|---|
| CPM (Cost Per Mille) | What advertisers pay YouTube for 1,000 ad impressions | Advertisers |
| RPM (Revenue Per Mille) | What you actually earn per 1,000 views after YouTube's 45% cut | Creators |
RPM is what hits your bank account. When YouTube reports a $10 CPM, your RPM is roughly $5.50 after YouTube's share. All figures in this article use RPM since that reflects actual artist earnings.
Note YouTube takes 45% of ad revenue. Your RPM is always lower than the advertiser CPM. Focus on RPM when evaluating your earnings.
What Does Dynamoi's First-Party YouTube RPM Data Show?
The current country-level RPM data lives at YouTube AdSense RPM by country. Use that page for live figures instead of copying a fixed table from this article.
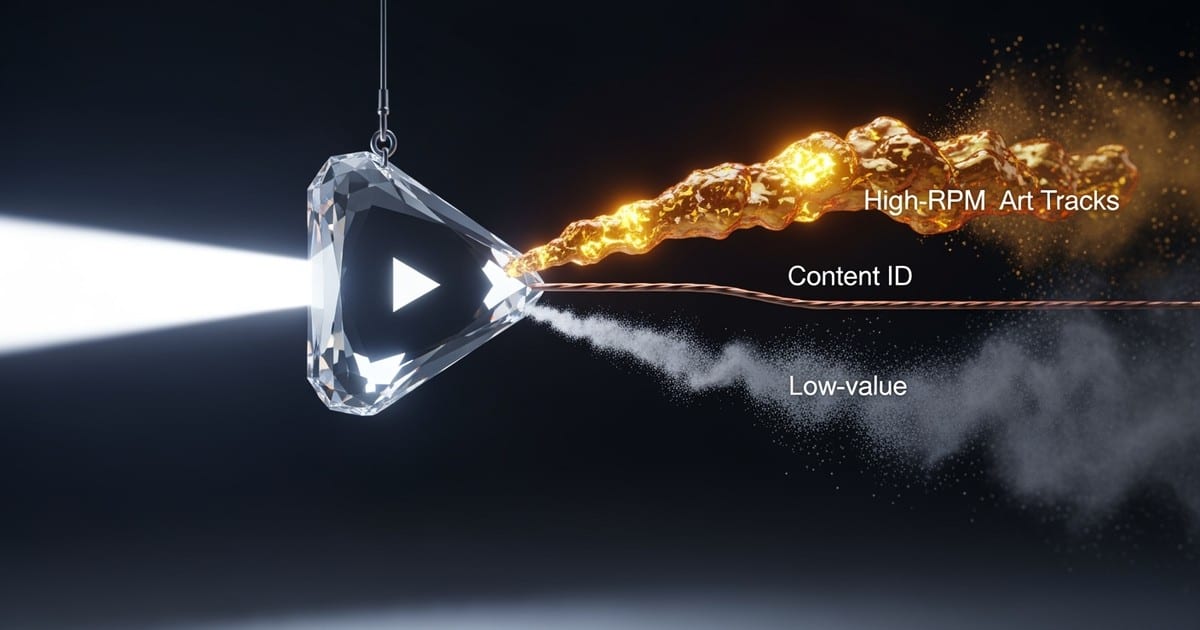
The durable pattern is that direct YouTube monetization usually beats incidental Content ID claims. Art Tracks and owned music videos monetize the content you control. Content ID monetizes other people's videos that happen to include your music, so the revenue is often diluted by attribution, context, and creator splits.
What Is the RPM in Tier 1 Markets? (Dynamoi Data)
Geography is the single largest factor in YouTube music earnings. Start with the live country pages for United States, United Kingdom, Germany, Japan, Australia, and Canada.
Tip Premium ad markets often outperform low-CPM markets on YouTube RPM, but volume still matters. Factor both live country RPM and reachable audience size into targeting decisions.
What Is the RPM in Tier 2 and Tier 3 Markets?
Lower-CPM markets can still drive significant revenue at scale, but paid promotion rarely makes sense if the only goal is direct ad payback. Use Mexico, Brazil, India, Indonesia, and the full YouTube RPM dashboard to compare current country economics.
Warning Cheap views can destroy effective RPM when they come from low-ad-value markets. Optimize paid campaigns for revenue-adjusted outcomes, not lowest cost per view.
How Do Art Tracks Compare to Uploaded Videos and Content ID?
Three distinct revenue streams exist on YouTube for music, and they pay very differently.
Art Tracks are auto-generated videos YouTube creates when you distribute audio through services like DistroKid, TuneCore, or CD Baby. They appear on YouTube Music topic channels with your album artwork as a static image. These generate the highest per-view revenue because ads serve directly on your content.
Uploaded videos (music videos, lyric videos, visualizers) on your own channel generate revenue through the YouTube Partner Program once you hit 1,000 subscribers and 4,000 watch hours. Revenue depends on your audience geography and video length. Videos over 8 minutes can include mid-roll ads, significantly increasing RPM.
Content ID revenue comes when your music is detected in other creators' videos. YouTube's Content ID system matches audio fingerprints and either blocks, tracks, or monetizes those videos on your behalf. Content ID claims typically generate lower RPM because the ad revenue is split with the video creator.
| Revenue Type | Avg RPM | Best For |
|---|---|---|
| Art Tracks | $3.66-$5.64 | Passive catalog monetization |
| Uploaded videos (8+ min) | $4-$8+ | Engaged channel audiences |
| Content ID | $0.47-$2.97 | Viral/UGC exposure |
Why music RPM is lower than other niches
Music consistently ranks among the lowest-paying YouTube niches. Industry-wide data shows music CPMs averaging $1.36, compared to finance ($15-$50) or education ($10-$25).
Three factors drive this gap:
Audience demographics. Music audiences skew younger with less purchasing power. Advertisers pay premiums for audiences likely to buy high-margin products.
Watch time patterns. Music videos are often 3-4 minutes. Shorter videos mean fewer ad slots. A 12-minute tutorial can run 3+ mid-roll ads; a music video typically runs one pre-roll.
Background listening. Many music views come from background play where viewers are not actively watching. Advertisers value engaged attention more than ambient listening.
How to increase your YouTube music RPM
Several levers can move your effective RPM without changing your genre:
Target Tier 1 geographies. If running paid promotion, focus spend on US, UK, Germany, and Japan. A UK view at $9.13 RPM is worth 10x an Indian view at $0.91.
Extend video length. Lyric videos, visualizers, and behind-the-scenes content over 8 minutes unlock mid-roll ad placements. Even a 2x increase in ads per video compounds significantly at scale.
Build playlists. Sequencing your videos into playlists increases session time and monetized minutes per viewer. YouTube's algorithm favors content that keeps people on platform.
Improve first-30-second retention. Videos with high early drop-off generate fewer completed ad views. Hook viewers immediately with compelling visuals or a strong opening moment.
Diversify content. Gear breakdowns, studio sessions, and music business content attract older viewers with higher advertiser value. These videos can subsidize lower-RPM music content.
What Are the Seasonal RPM Patterns?
RPM fluctuates throughout the year based on advertiser spending cycles. Q4 usually pays better because holiday advertisers spend aggressively, while January often resets lower after holiday budgets close. Summer can also soften depending on market and niche.
Do not time every release around RPM seasonality, but do factor it into paid campaign expectations. A campaign that looks break-even in November may look worse in January even if view quality is identical.
What Is the Bottom Line?
YouTube music earnings vary heavily by content type and geography. Use the live YouTube AdSense RPM data for current country benchmarks, then adjust for whether you are monetizing Art Tracks, owned uploads, Shorts, or Content ID.
For editorial interpretation, see YouTube RPM by Country. For Art Track-specific mechanics, see How Do YouTube Art Track Royalties Work.