What Do Healthy vs. Unhealthy Metrics Look Like?
| Metric | Healthy range | Unhealthy signal |
|---|---|---|
| Video view rate (3s+) | 15% or above | Below 8% means the hook is not working |
| Click-through rate | 1% or above | Below 0.5% means poor hook-to-CTA bridge |
| Landing page to save rate | 20% or above | Below 10% means landing page friction or wrong audience |
| Cost per save | Varies by market; under $1.50 is strong in Tier 2 | Above $3 in Tier 2 warrants creative or objective review |
| Frequency | Under 3 in first week | Above 4 means audience is saturating fast |
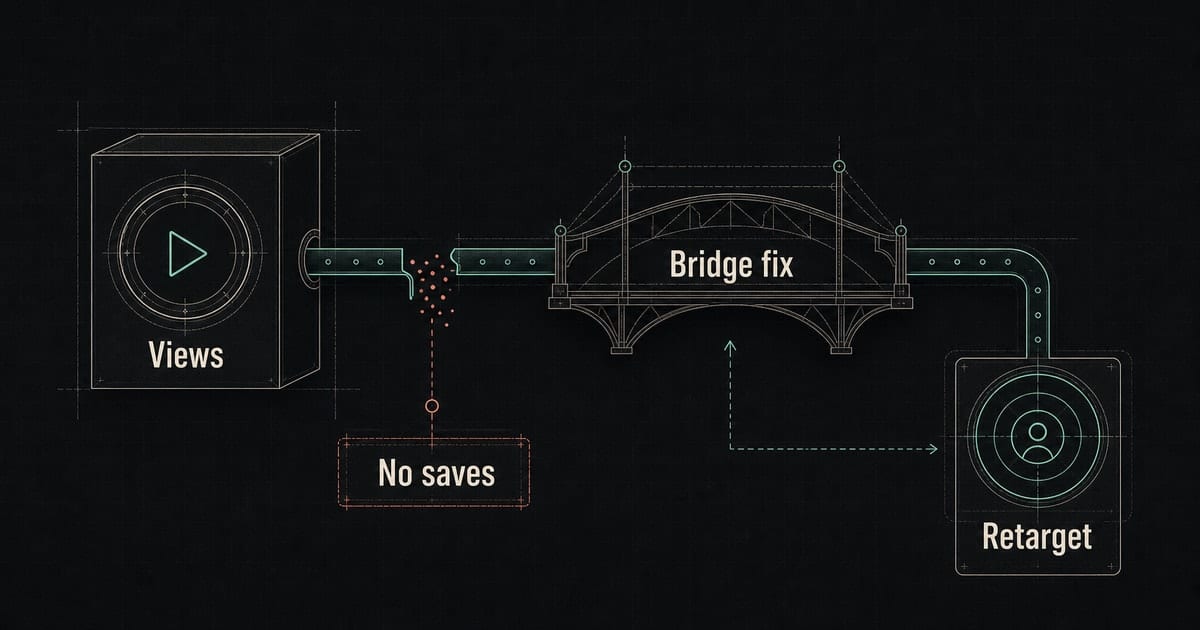
Views are not the goal. Fit is. Saves are the easiest fit signal you can buy.
If your view numbers look strong but the save rate is near zero, work through the three causes above in order. The most common culprit is objective mismatch (Cause 3), because it is invisible in the dashboard unless you look at campaign settings directly.
For more on structuring the full funnel, see Instagram ads funnel to Spotify and YouTube.