Analytics
Campaign Optimization
Use Dynamoi analytics to decide when to keep running, pause, compare, adjust targeting, or launch a new campaign.
Use analytics to decide what to do next: keep running, pause, or launch a new campaign with different settings.
Start with date range and learning
If a campaign shows the Learning badge, expect more day-to-day variance. Use multi-day trends instead of single-day numbers.
The Last 7 days and Last 28 days views are usually the fastest way to spot trend direction.
Smart Campaign metrics to focus on
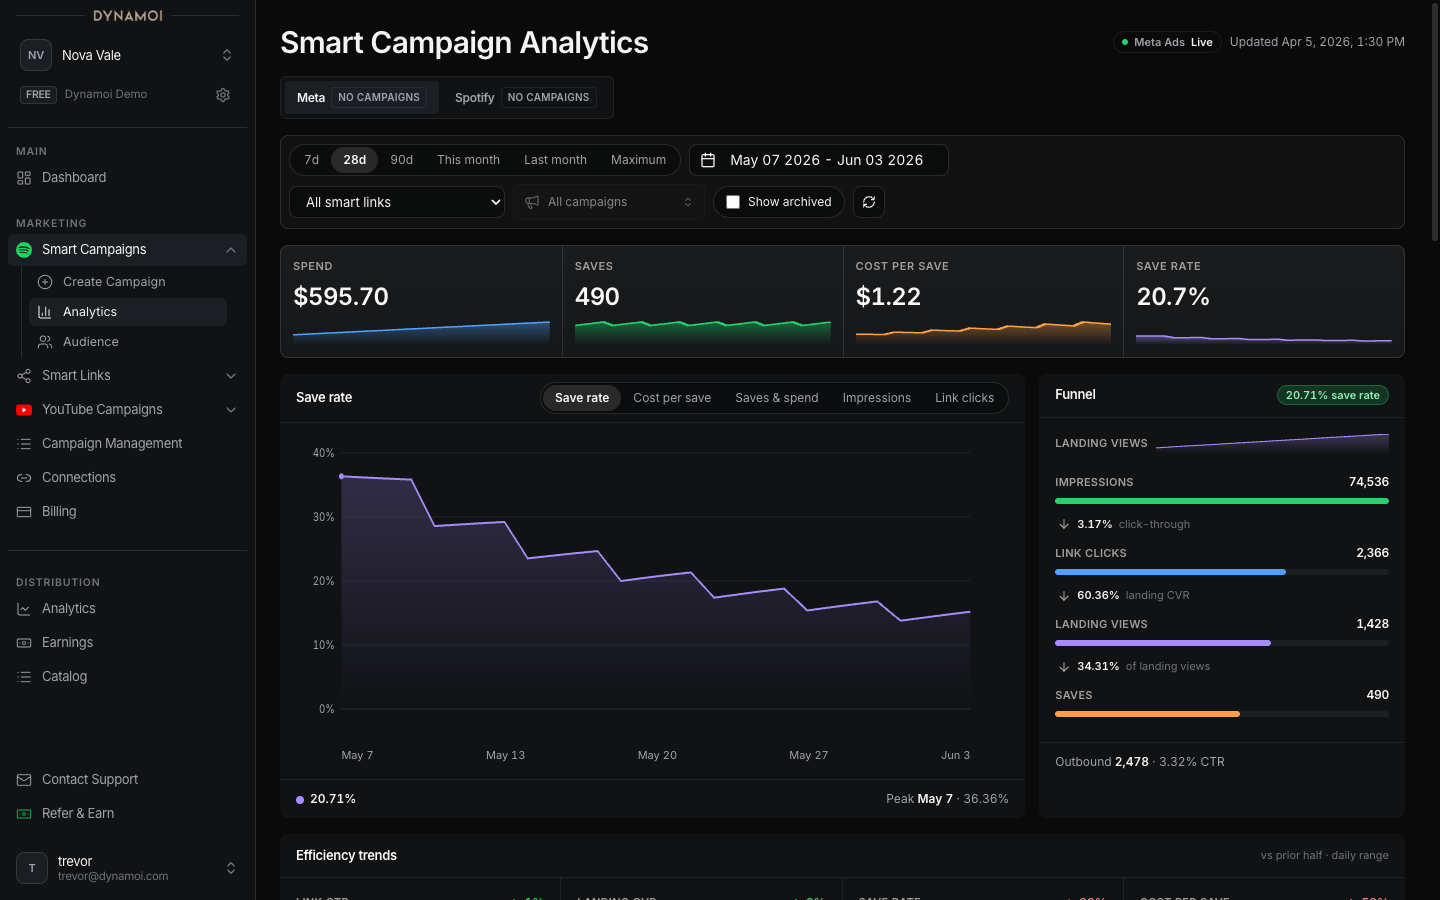
Smart Campaign analytics are built around a small set of core metrics:
Spend (USD)- billable ad spend for the selected datesSaves- the primary conversion event for Smart CampaignsSave Rate-Savesdivided byLink ClicksCost per Save-Spend (USD)divided bySavesLink Clicks- clicks from the ad to your Smart Link landing page
Reading the Analytics Dashboard
Use breakdowns to understand where results are coming from:
Countries and placements
Country and placement breakdowns are useful for identifying which audiences are driving results and which are not contributing.
Next actions in Dynamoi
Review trends Use
Last 7 daysandLast 28 daysto compare recent results vs. your baseline.Decide whether to pause If you need to stop spend, pause the campaign from Campaign Management.
Launch an updated campaign If you want different targeting, budgets, or creative, create a new campaign with the updated settings.