Distribution
Distribution Analytics
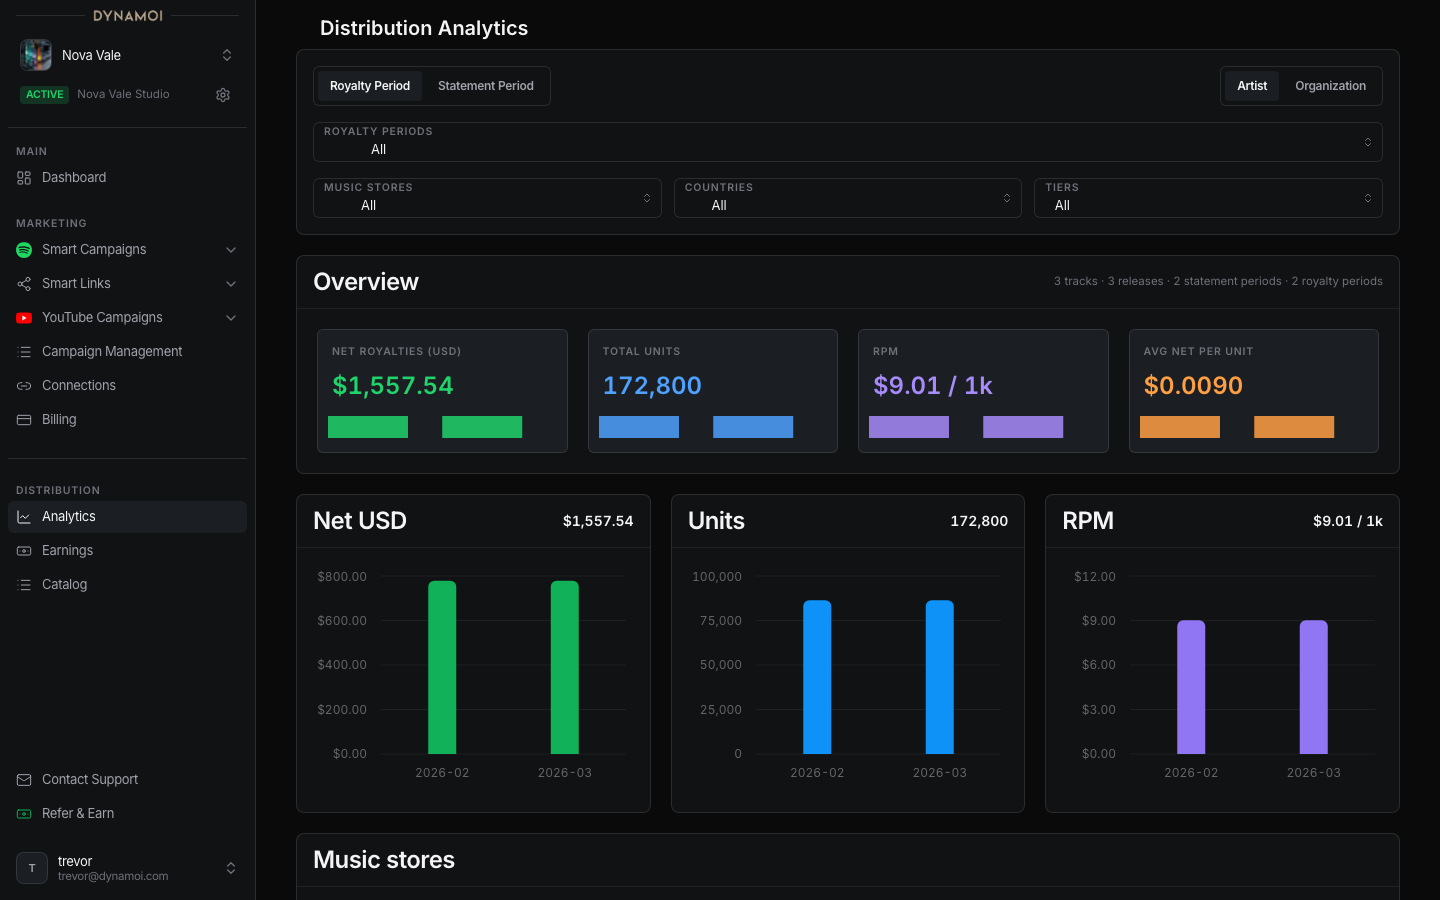
Analyze Dynamoi distribution net revenue by store, country, listener tier, royalty period, track, and statement context.
Distribution Analytics breaks down net revenue by store, country, tier, and time period.
Accessing analytics
Navigate to Distribution > Analytics in your dashboard.
Viewing scope
You can analyze data at two levels:
| Scope | Description |
|---|---|
| Artist | Data for the currently selected artist |
| Organization | Combined data across artists in the organization |
Period mode
Analytics supports two period modes:
| Mode | Description |
|---|---|
| Statement Period | Grouped by statement period |
| Royalty Period | Grouped by royalty period |
Key metrics
| Metric | What it means |
|---|---|
Net USD |
Total net revenue shown in USD |
Units |
Total units for the view |
RPM |
Revenue per 1,000 units |
Use filters and breakdowns to understand which stores, countries, and tiers are driving results.